Branched and Bullet Infographics: A Visual Tool for Clarity in Complex Processes
Visual communication plays a critical role in how we process information, make decisions, and convey ideas. Branched and Bullet Infographics offer a structured yet flexible way to represent relationships, hierarchies, and sequences in a visually digestible format. These templates are particularly useful for professionals, educators, and creators who need to explain multi-step processes, decision trees, or data relationships in a clear and visually engaging manner.
Understanding the Structure of Branched and Bullet Infographics
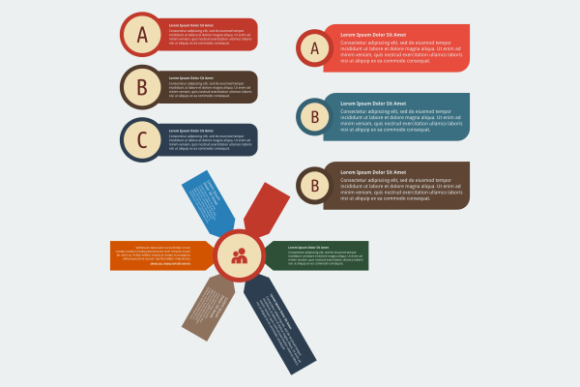
At their core, Branched and Bullet Infographics combine two visual elements: branches and bullet points. Branches illustrate connections or divergences, often used to show how a central idea leads to multiple outcomes or how different paths converge. Bullets, on the other hand, provide concise, point-based details that support or clarify each branch. Together, they create a visual narrative that's both informative and easy to follow.
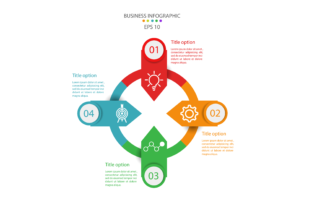
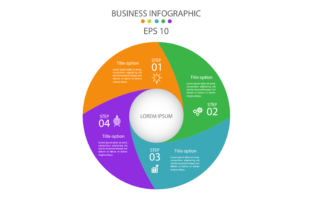
These infographics are typically laid out in a circular or radial format, with a central node representing the main topic or starting point. From there, branches extend outward, each labeled with a key idea or category. Bullet points attached to each branch offer sub-points or supporting details, making the structure ideal for illustrating strategies, workflows, or comparative data.
How Branched and Bullet Infographics Fit Into Real-World Workflows
These templates are not just visual aids—they are practical tools that can be integrated into various stages of a project or decision-making process. Here’s how they can be used effectively across different phases:
- Planning Phase: Use a branched infographic to outline possible directions or options before committing to a strategy. This helps stakeholders visualize different outcomes and understand the implications of each choice.
- Execution Phase: During implementation, bullet points can serve as checklists or progress indicators. Each branch can represent a department, task, or milestone, with bullets tracking sub-tasks or deliverables.
- Review and Reporting: After a project concludes, a branched diagram can summarize what happened, showing how initial plans evolved and what results were achieved. This makes it easier to analyze performance and communicate learnings to a broader audience.
Integration with Other Tools and Platforms
Branched and Bullet Infographics are most powerful when used alongside other tools and systems. Here are some common integrations:
- Project Management Software: Exporting a visual plan from a tool like Trello, Asana, or Notion into a branched infographic can help communicate complex workflows to non-users or external stakeholders.
- Presentations: Incorporating these visuals into slide decks enhances clarity, especially when explaining processes, strategies, or organizational structures.
- Marketing and Sales Materials: Use branched infographics to show how a product or service fits into a customer’s decision-making process or how different features relate to user needs.
- Training and Onboarding: Visualizing company policies, team structures, or onboarding steps can help new employees understand their role within a larger context.
Because these templates are available in SVG, EPS, PDF, and PNG formats, they can be easily embedded into documents, websites, or printed materials without losing quality.
Practical Tips for Using Branched and Bullet Infographics
To get the most out of these templates, consider the following best practices:
- Start with a Clear Objective: Know what you want the viewer to understand or decide after seeing the infographic. This will guide your layout and content choices.
- Keep It Balanced: Avoid overcrowding a single branch with too many bullets. If a section becomes too dense, consider splitting it into sub-branches or simplifying the content.
- Use Consistent Visual Language: Stick to a single color scheme, font style, and icon set to maintain professionalism and readability.
- Edit in Inkscape for Precision: The included SVG files are designed for use with Inkscape, a free vector graphics editor. This allows for detailed customization without compromising resolution.
- Export for Different Uses: Use the PDF for print, the high-resolution PNG for websites or presentations, and the EPS for compatibility with professional design software.
Use Cases Across Industries and Roles
These infographics are versatile enough to serve a wide range of professionals:
- Marketers: Illustrate customer journeys, campaign strategies, or content calendars.
- Entrepreneurs: Visualize business models, product development paths, or market expansion plans.
- Educators: Show learning pathways, curriculum structures, or student progress tracking.
- Developers: Document system architecture, API relationships, or workflow logic.
- Freelancers: Present service packages, project timelines, or client onboarding processes.
Each use case benefits from the clarity and organization that branched and bullet visuals provide, especially when complex information needs to be distilled into a digestible format.
Ensuring Long-Term Value and Reusability
One of the advantages of using editable SVG templates is that they can be reused and updated as your needs evolve. Whether you're updating a marketing strategy, revising a training module, or adjusting a project plan, having a flexible visual format ensures your content remains relevant without starting from scratch.
To maintain consistency over time:
- Save a master template with your brand colors and fonts.
- Create a folder of commonly used icons or design elements.
- Keep a record of how each infographic was used and its effectiveness.
This approach not only saves time but also builds a library of visual assets that align with your brand identity and communication style.
Conclusion: Making Visual Clarity a Part of Your Routine
Branched and Bullet Infographics are more than just a design asset—they're a practical solution for anyone who needs to explain complex relationships in a simple, engaging way. By integrating these templates into your planning, execution, and communication workflows, you can improve clarity, enhance collaboration, and ensure your message is understood the first time around.
Whether you're mapping out a business strategy, explaining a technical process, or presenting data to a non-technical audience, these infographics provide a visual foundation that supports your goals. With the right tools—like Inkscape—and a thoughtful approach to design and structure, you can make these visuals a regular part of your professional toolkit.